
Your Map is shown over high-resolution satellite imagery. Overlays add additional datasets on top of that imagery to help you better understand the various region(s) your property belongs to. Open the Overlays panel by clicking 'Overlays' in the main menu.
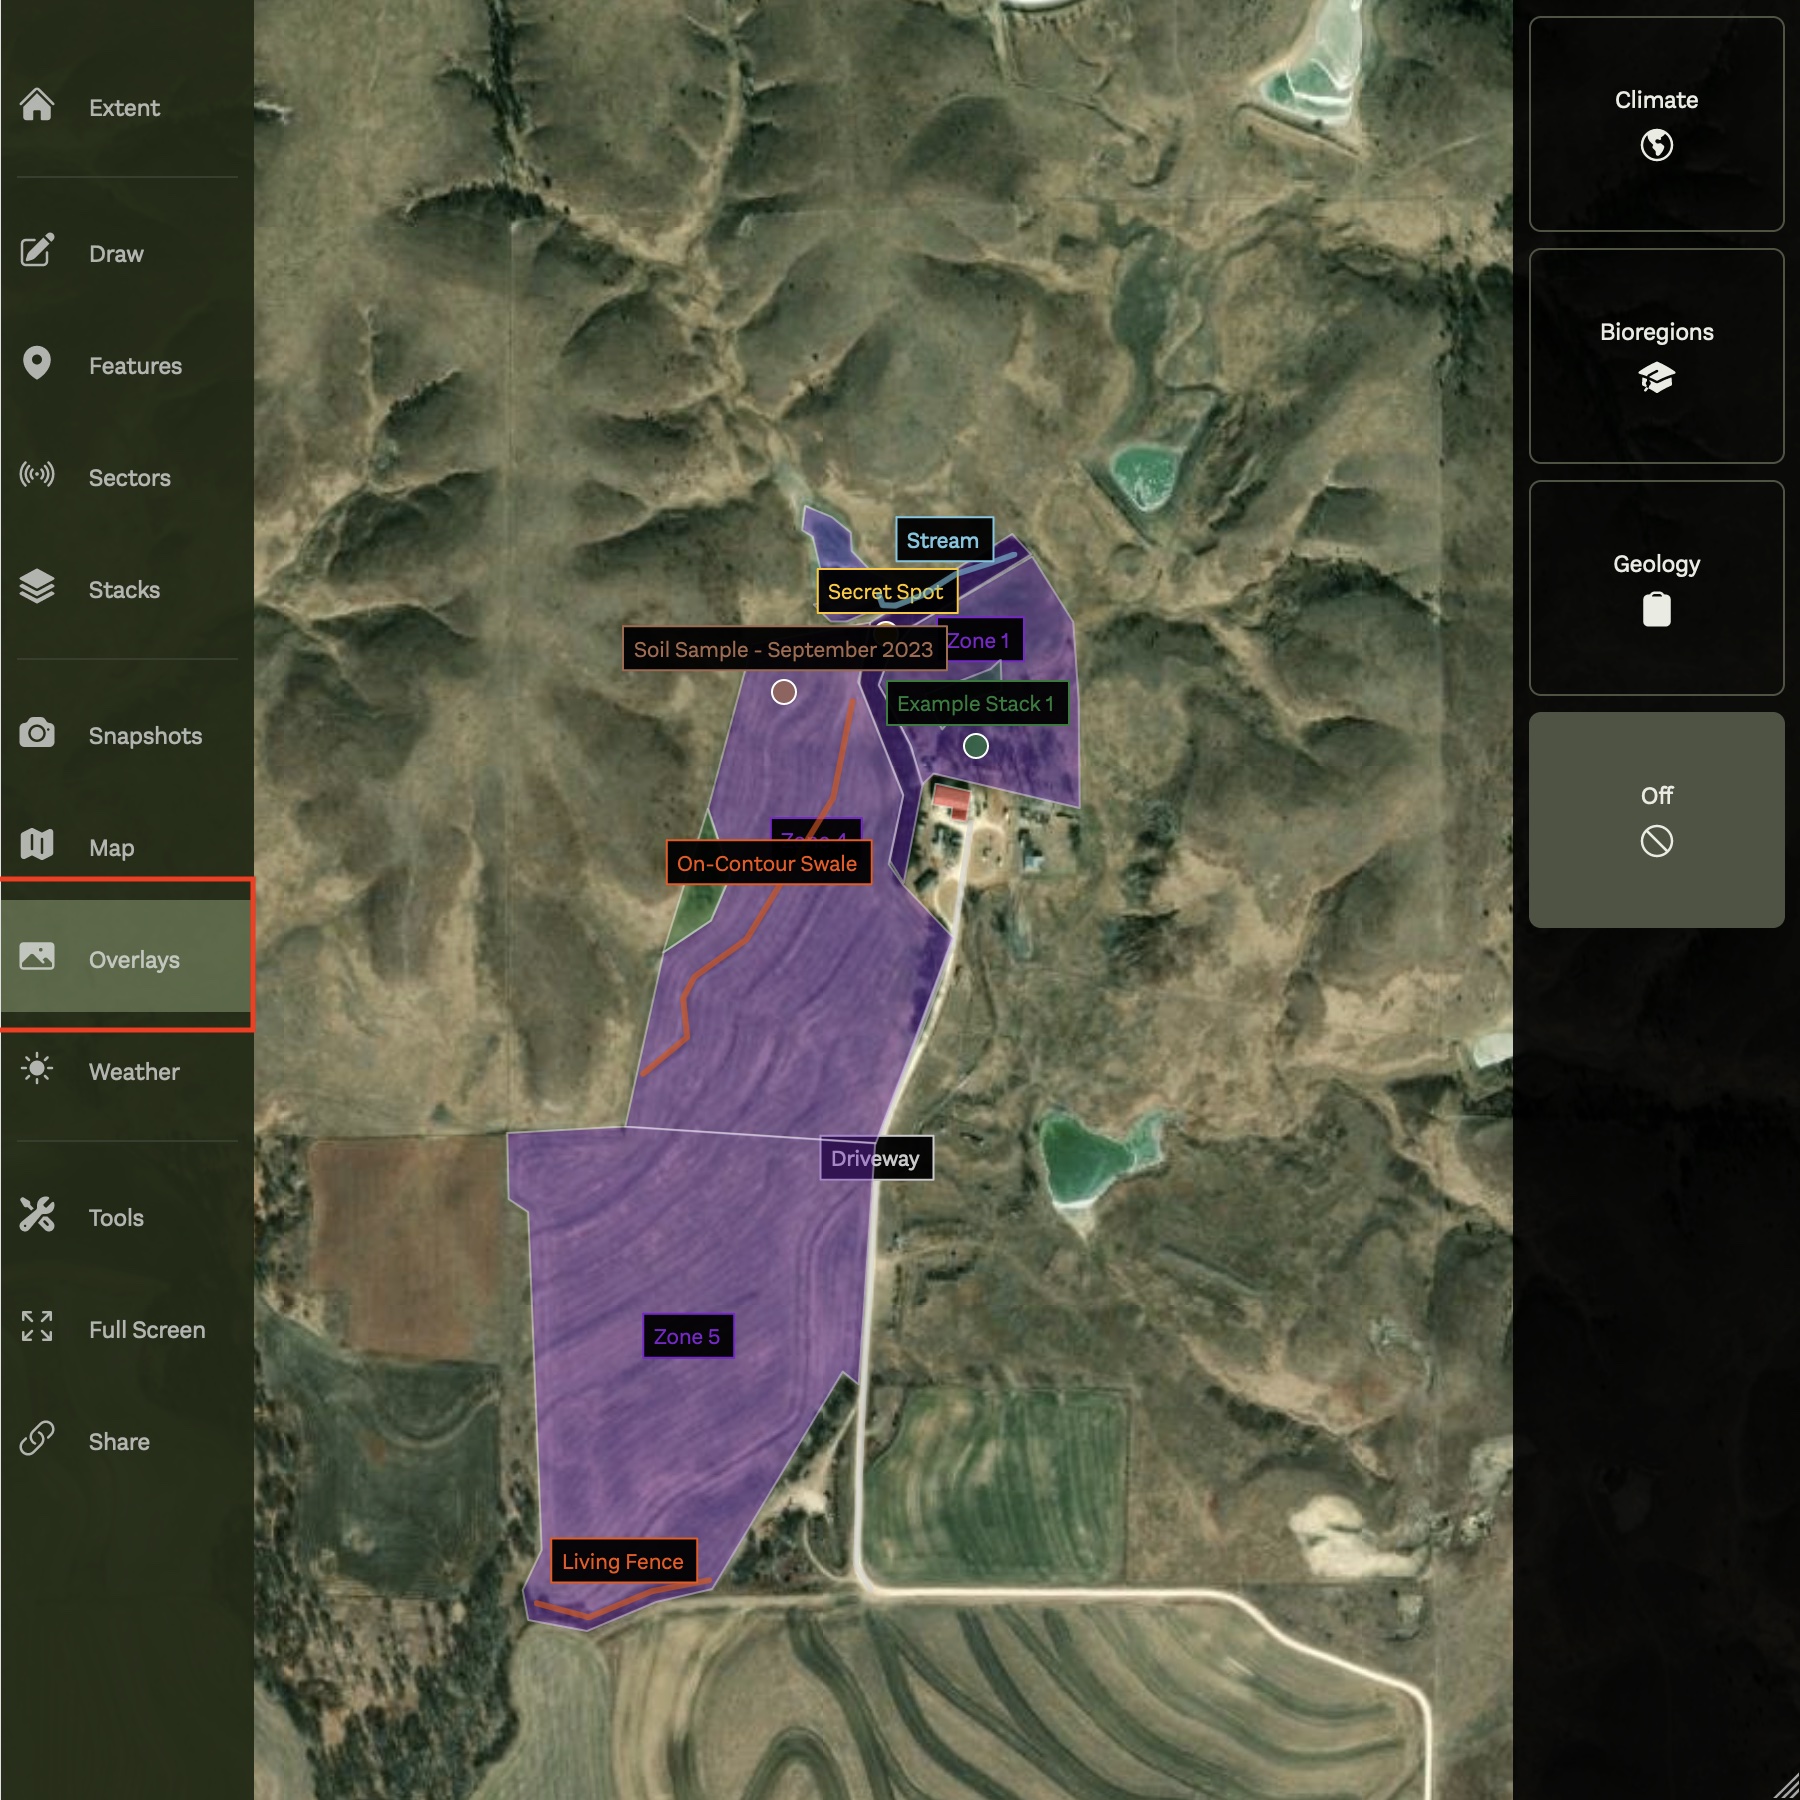
Overlays are organized into groups so you can find what you need:
- Climate - USDA hardiness zones and Köppen climate classification
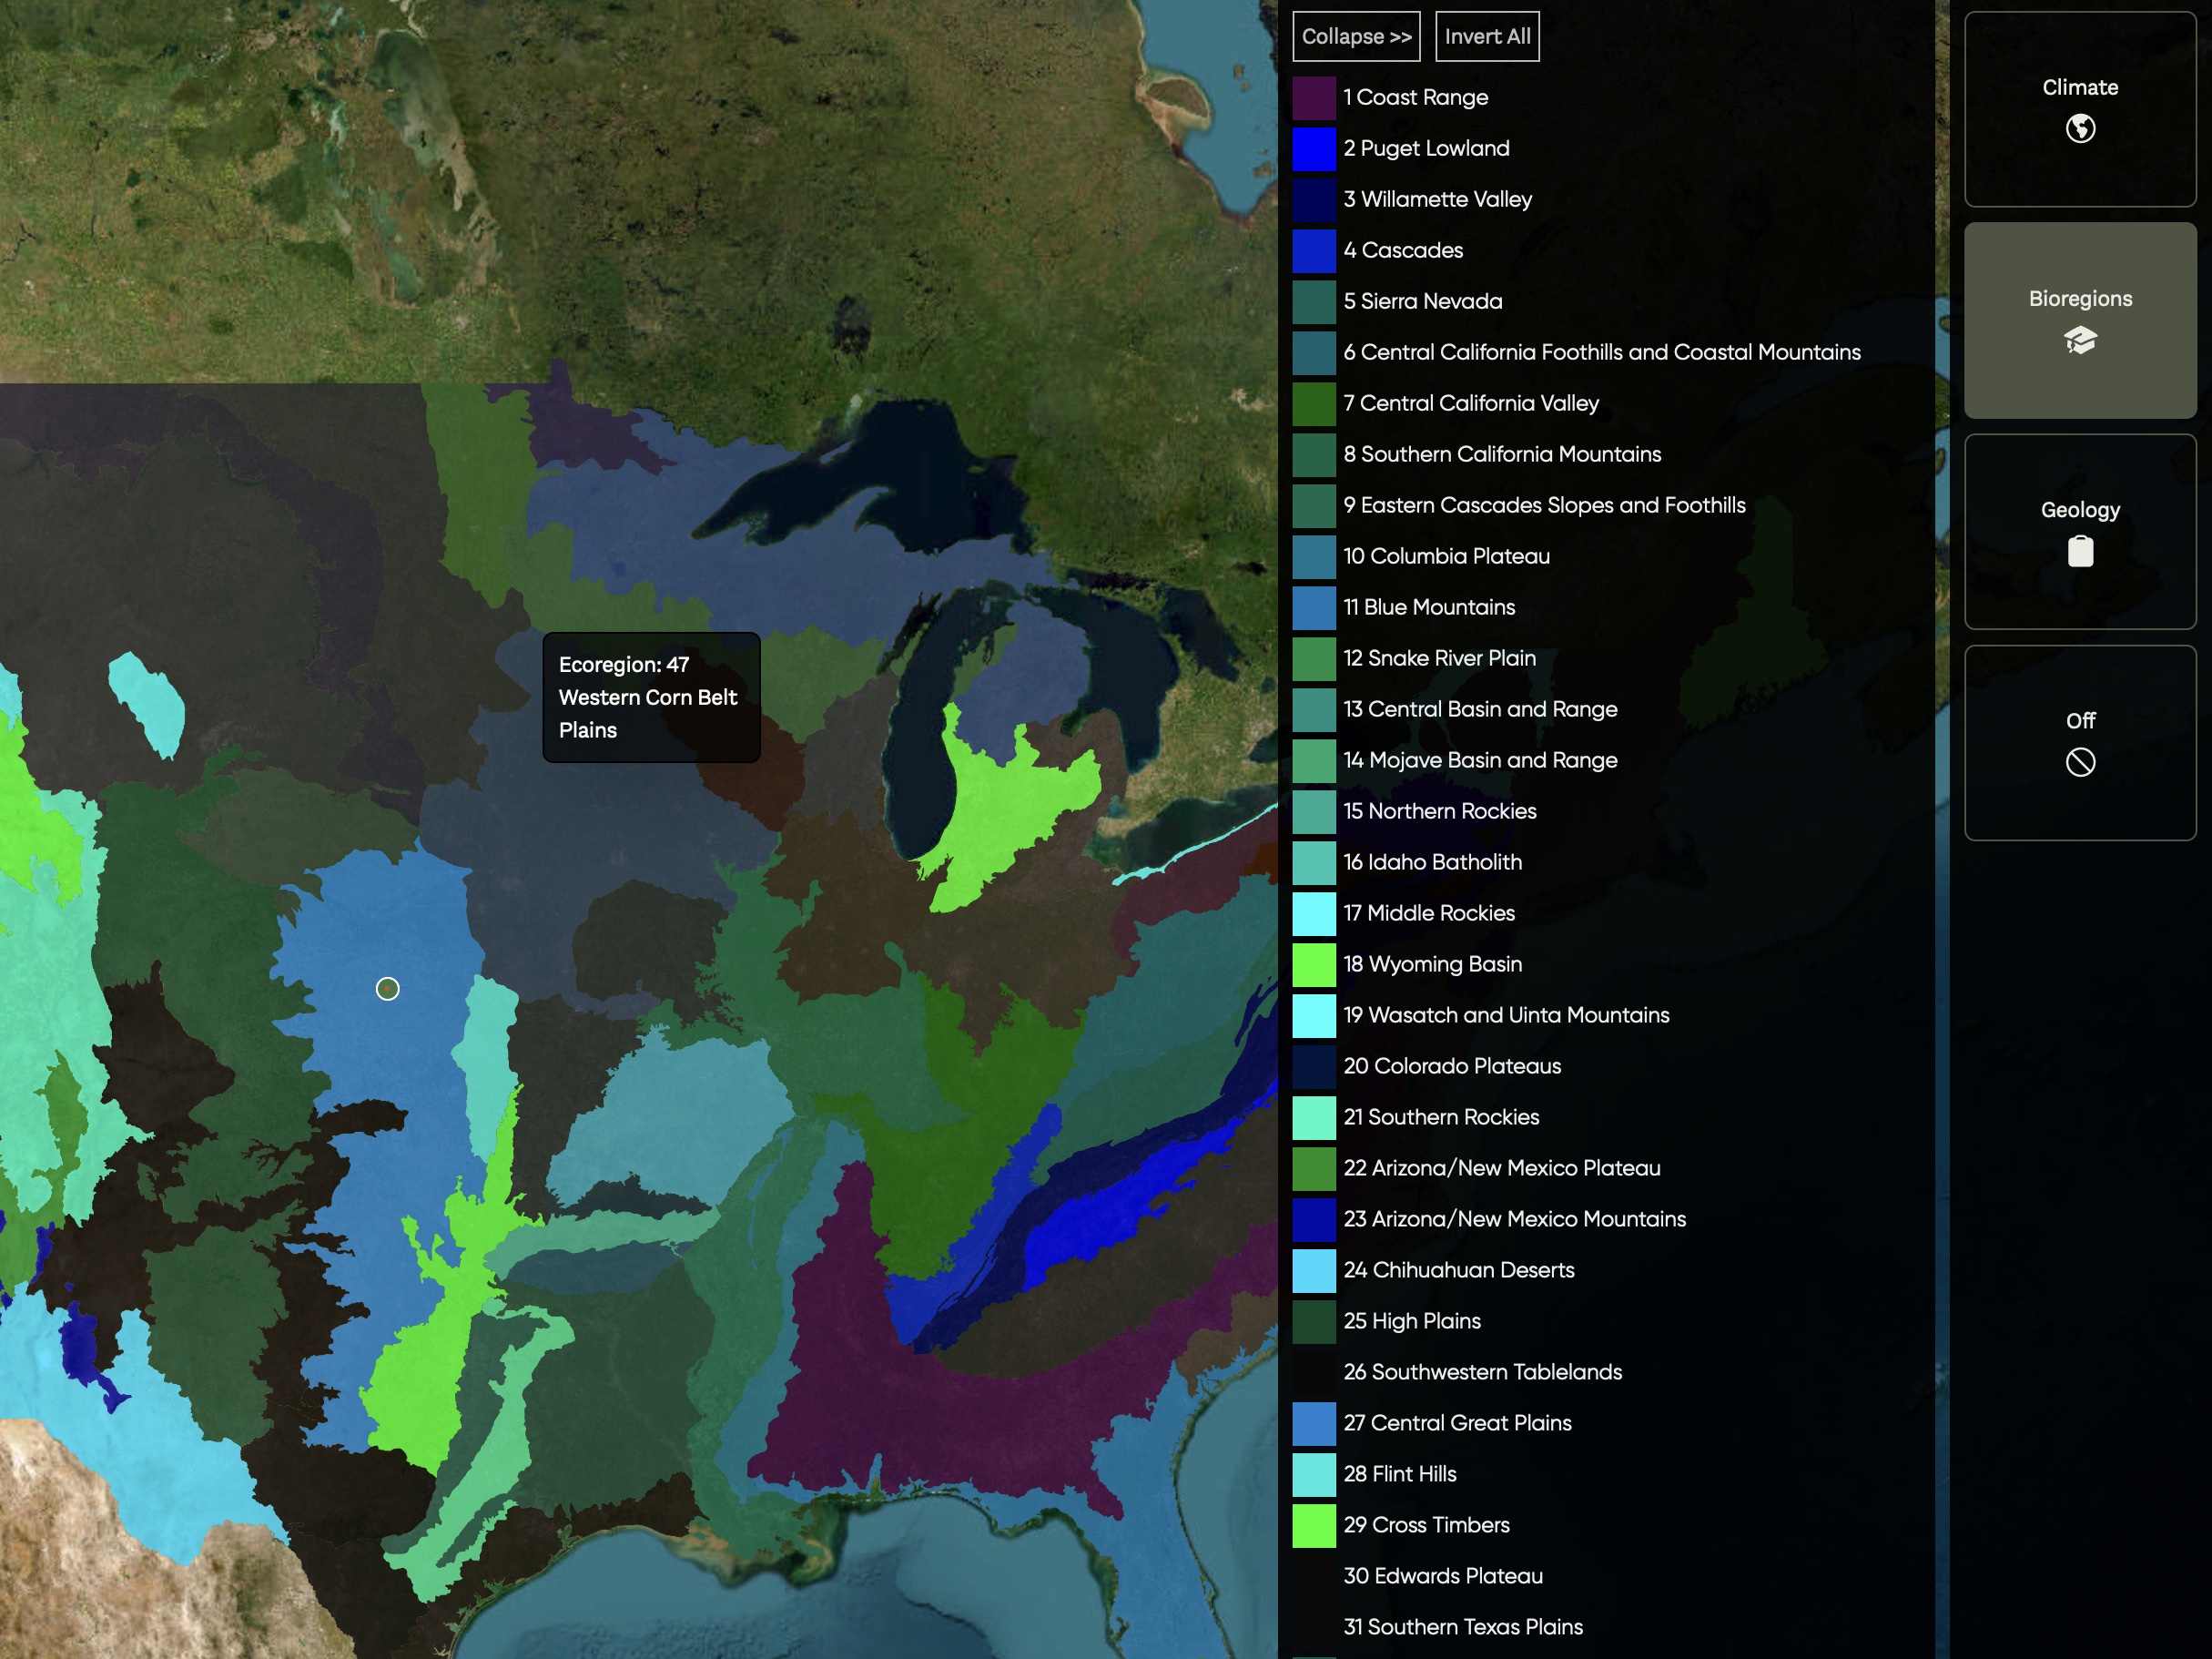
- Bioregions - EPA Level III and Level IV ecoregions
- Hydrology - watersheds, rivers & streams, water bodies, flood zones and wetlands
- Terrain - topographic contour lines and hillshade relief
- Boundaries - county and state administrative boundaries
- Soil - global soil data including soil class, sand/silt/clay content, nitrogen and pH
- Weather - live weather radar and precipitation type
Toggle any overlay on or off, and adjust its opacity with the slider to blend it with the satellite imagery. Active overlays are grouped at the top of the list, and the 'Reset all' button clears them in one click.
Bring your own map layer
The overlays above are curated datasets we provide, but we know your property is unique. Whether you have your own imagery to add or a beautiful hand-drawn map you'd love to make interactive, we'd like to help.
Already have imagery you'd like on your Map, or artwork you'd love to see come alive as an interactive map? Let us know whether custom map overlays or hand-drawn artistic map support matters to you.
Custom overlays
You've got a digital image or tileset (a site plan, drone imagery, a survey, existing GIS data) and want to add it to your Map yourself. This one's on our roadmap.
Get notifiedArtist-rendered maps
You've got (or want) a hand-drawn map, and would love help turning it into a live, interactive layer. Permaculture is a design-heavy craft, so we'd rather augment artists than replace them.
Get in touch